Crypto Fear and Greed Index hits 10, Extreme Fear: what it measures, how it is built, past extreme readings and what it does and does not tell traders
The crypto fear and greed index published by alternative.me stood at 10 out of 100, "Extreme Fear", on 16 November 2026, the same as on 15 November and its lowest reading since June. The value is set once a day at 00:00 UTC. Bitcoin traded at $64,427 at 05:56 UTC on 16 November, according to CoinGecko, down from $81,274 on 29 October, when the index still read 51, Neutral. CoinMarketCap's separate index showed 13 out of 100 at about the same time. This article sets out the readings for the past month, how the index is built, how it differs from other fear and greed indexes, past extreme readings with exact dates, and what it can and cannot tell you. All times are UTC.

 NO KYCSign up to BloFin
 Sign up to Bybit
 Sign up to OKX
 Sign up to Bitget
 Sign up to MEXC
 Sign up to OrangeX
 Sign up to Toobit
What happened this month: the readings by date
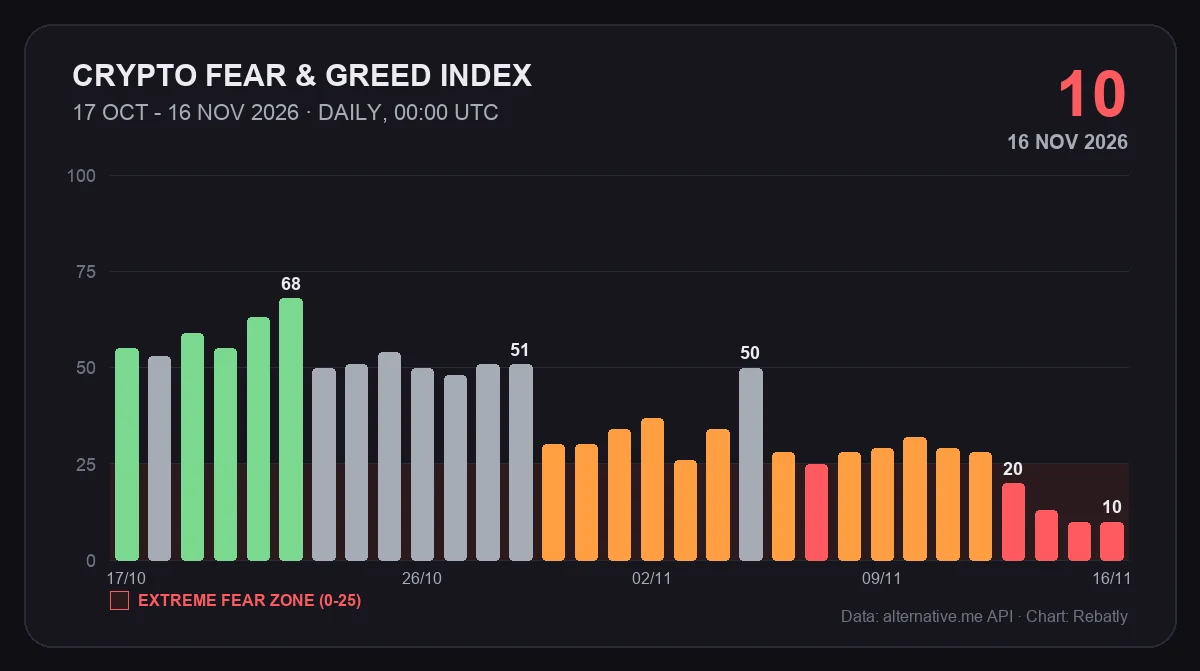
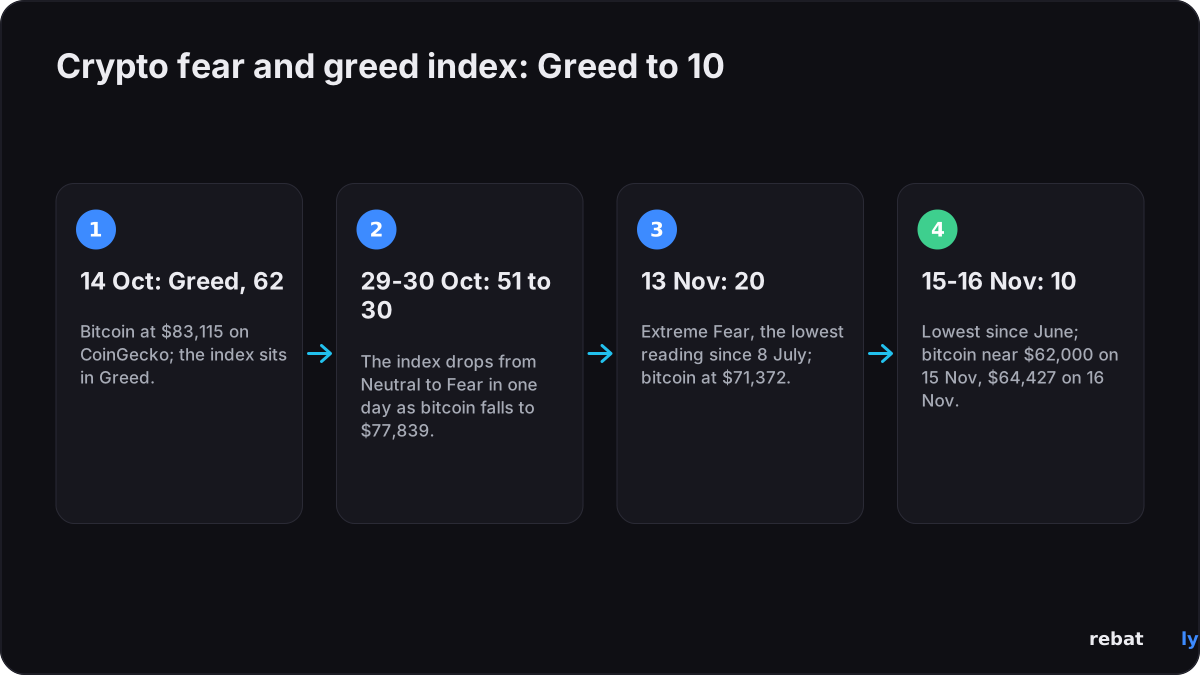
The index has fallen from Greed to Extreme Fear in a month. Readings below are from alternative.me's public API (one value per day, dated 00:00 UTC); bitcoin prices are CoinGecko's daily price at 00:00 UTC on the same date.
| Date (UTC) | Index | Label | Bitcoin price |
|---|---|---|---|
| 14 Oct | 62 | Greed | $83,115 |
| 22 Oct | 68 | Greed | $84,082 |
| 29 Oct | 51 | Neutral | $81,274 |
| 30 Oct | 30 | Fear | $77,839 |
| 5 Nov | 50 | Neutral | $80,443 |
| 7 Nov | 25 | Extreme Fear | $75,775 |
| 10 Nov | 32 | Fear | $75,267 |
| 13 Nov | 20 | Extreme Fear | $71,372 |
| 14 Nov | 13 | Extreme Fear | $68,314 |
| 15 Nov | 10 | Extreme Fear | $64,120 |
| 16 Nov | 10 | Extreme Fear | $65,305 |
The reading of 20 on 13 November was the lowest since 8 July, Cointelegraph noted, and the API data agrees. The last time the index was at 10 or below was 8 to 10 June 2026. Over the same days bitcoin fell to about $62,000 on 15 November, its lowest level since July, according to The Block and Cointelegraph. CoinDesk put the weekly drop at 17% on 14 November. Decrypt counted about $2.1 billion of net outflows from US spot bitcoin ETFs in November, and The Block cited CoinGlass data showing $2.02 billion of liquidations in the 24 hours to 13:00 UTC on 15 November, $1.68 billion of them longs. For the drivers, see why bitcoin is down today and bitcoin ETF outflows.
What the index measures and how alternative.me builds it
The index turns several market and social signals into one number from 0 (Extreme Fear) to 100 (Extreme Greed). According to alternative.me's own page, it currently covers bitcoin only, because a large part of it is bitcoin's price volatility; the site says separate indexes for large altcoins will follow. The components and weights it lists:
| Component | Weight | What it measures |
|---|---|---|
| Volatility | 25% | Bitcoin's current volatility and maximum drawdowns against their 30-day and 90-day averages; unusually high volatility counts as fear |
| Market momentum and volume | 25% | Current volume and momentum against 30-day and 90-day averages; heavy buying in a rising market counts as greed |
| Social media | 15% | Posts and interactions on bitcoin-related hashtags on X (Twitter); Reddit analysis is not yet in the live index |
| Surveys | 15% | Weekly crypto polls; listed as currently paused |
| Dominance | 10% | Bitcoin's share of the total crypto market; a rising share counts as fear, a falling one as greed |
| Trends | 10% | Google Trends data for bitcoin-related search terms |
The page does not say how the 15% surveys weight is handled while the polls are paused. The labels in the API data map to these ranges: 0 to 25 Extreme Fear, 26 to 46 Fear, 47 to 54 Neutral, 55 to 75 Greed and 76 to 100 Extreme Greed. The highest reading on record is 95, first reached on 26 June 2019 and last on 17 February 2021. The lowest is 5. The API history starts on 1 February 2018.
Other fear and greed indexes, and how they differ
"Fear and greed index" is a name, not a standard. The three most searched versions measure different things, so their readings do not match:
| Index | Covers | Built from | Reading around 16 Nov |
|---|---|---|---|
| alternative.me | Bitcoin | Volatility, momentum and volume, social media, surveys (paused), dominance, search trends | 10 |
| CoinMarketCap | Crypto market | Price momentum of the top 10 coins, BTC and ETH implied volatility, options put/call ratio, stablecoin supply ratio, CoinMarketCap's own search and engagement data | 13 |
| CNN Business | US stocks | Seven stock market indicators, including market momentum, put and call options, junk bond demand and safe haven demand | Not a crypto index |
CoinMarketCap describes its index as its own tool with a weighting system it does not publish; alternative.me publishes its weights. CNN says its index is built from seven indicators of stock market behaviour, so it says nothing direct about crypto. When a headline quotes a "fear and greed" number, check which index it is: on 16 November alternative.me showed 10 and CoinMarketCap 13.
Past extreme fear readings
Readings of 10 or below are rare but not unique. All values below are from alternative.me's API history, one value per day:
| Date (UTC) | Index | Context |
|---|---|---|
| 22 Aug 2019 | 5 | Lowest reading on record (tied) |
| 14 Mar 2020 | 8 | Covid market crash; 10 on 13 March |
| 10 May 2022 | 10 | Terra (LUNA) and UST collapse; 10 again on 13 May |
| 18-19 Jun 2022 | 6 | Lowest of 2022, during the June 2022 selloff |
| 17 Nov 2022 | 20 | Lowest reading in the month FTX collapsed |
| 12 and 23 Feb 2026 | 5 | Equal to the record low |
| 8 Jun 2026 | 8 | Last reading below 10 before November |
| 15-16 Nov 2026 | 10 | Current reading |
Two things stand out. First, the FTX collapse in November 2022 never pushed the index below 20, while the Terra collapse and the June 2022 selloff did. Second, 2026 has been unusually fearful: the index has closed at 10 or below on 31 days this year, counting 15 and 16 November, and in the Extreme Fear range on 127 days. A low reading on its own does not tell you what happens next.
What the index can and cannot tell you
• It is a sentiment gauge, not a signal. It summarises how volatile, active and anxious the market has been. It does not tell you when to buy or sell, and Rebatly does not forecast prices.
• It looks backwards. Volatility and momentum are measured against the past 30 and 90 days, and the value is set once a day, so it lags fast moves within the day.
• It is bitcoin-centric. The alternative.me index covers bitcoin only; a coin such as XRP can move differently (see why XRP is down).
• Inputs change. The surveys component is paused and the social media input depends on one platform, so today's 10 is not built exactly like a 10 in 2020.
• Extremes can last. In 2026 the index stayed in Extreme Fear for weeks at a time.
Some traders quote Warren Buffett's saying about being greedy when others are fearful. That is a saying, not a rule, and nothing here is a recommendation. This is general information, not financial advice.
What traders can check in volatile markets
• Liquidation price: every major exchange shows an estimated liquidation price for each open position. In fast markets it can be reached quickly; our guide to crypto liquidations explains how forced closures work.
• Funding: perpetual positions pay or receive funding, usually every eight hours. See funding rates vs trading fees.
• Fees: futures fees are charged on the full position size, not the margin, so leverage multiplies them. Spot trades have no liquidation price.
• Margin mode: isolated margin limits a liquidation to the margin on one position; cross margin can draw on the whole balance.
• Event days: Fed decisions often bring wider spreads and bigger swings. See FOMC and crypto trading costs.
This is general information, not financial advice.
What happens next
• Daily update: alternative.me sets a new value at 00:00 UTC each day; the next one is on 17 November.
• US spot bitcoin ETF flows: daily flow tables show whether the November outflows continue.
• 9 December, FOMC decision: the Fed ends its 8-9 December meeting with a rate decision, according to the Federal Reserve calendar.
We will update this article on the next extreme reading, in either direction.
Trade with lower fees
Volatile weeks mean more trades and more fees, and leverage multiplies what you pay on each one. Sign up through Rebatly and part of every trading fee comes back to you: up to 50% on Bybit and Bitget, up to 40% on BloFin and OKX, up to 60% on MEXC and up to 65% on OrangeX futures. On Toobit, code Rebatly gives up to 60%, credited by Toobit itself, and BloFin credits up to 40% itself every hour; the other rebates are paid daily in USDT. Our guide to how a fee rebate works explains the rest.
This article reports news and is not financial advice. Rebatly is an independent affiliate; not financial advice.
Get fees back on every trade
$10M+ rebates paid · Paid daily in USDT · No password or API keys, ever
Already signed up? Check your link and rebate with @rebatlybot on Telegram, or reach our support at @rebatly.
🔔 Get a Telegram alert each time your rebate is paid: tap “Activate notifications” in @rebatlybot. New to trading? Your first trade in 5 steps.
November 16, 2026 — published. Sources: alternative.me, CoinMarketCap, CNN, CoinGecko, Cointelegraph, The Block, CoinDesk, Decrypt, CoinGlass, Federal Reserve.